Patient Reported Data Patient Registry Platform
An intuitive, easy-to-use registry product that allows patients and/or guardians to enter non-clinical health information. This can be the distinct data gathering approach with your registry or can be combined with clinically reported data, to learn more, please visit: Clinically Reported Data.
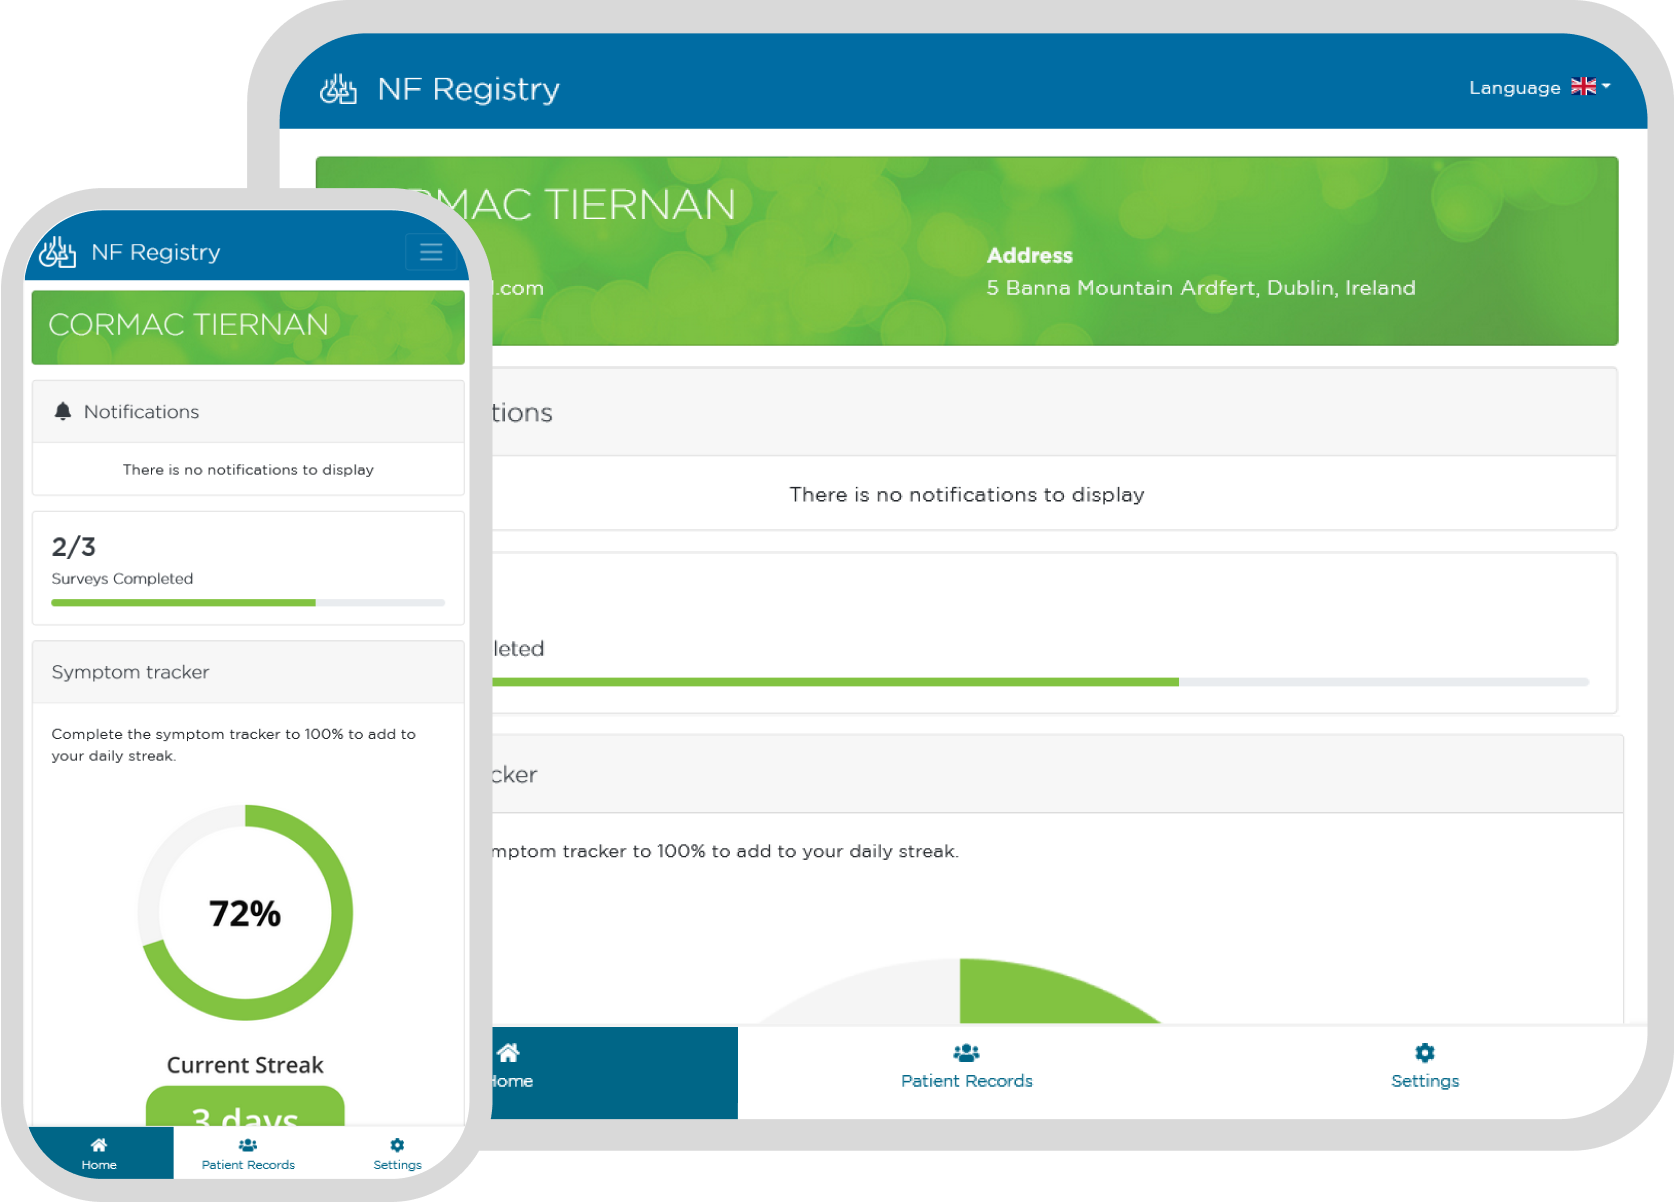
Communicate with and Support your Patient Community with our Patient Reported Data (PRD) Product
Enable your patient community to learn about and better understand their diagnosis. Keep them informed about upcoming trials and other news.
Present your patients and carers with a professional, branded user experience fostering trust and engagement in your registry.
Encourage long-term registry participation by communicating patient-specific information to your community.
Invite clinicians, patients and others to contribute to data collection.
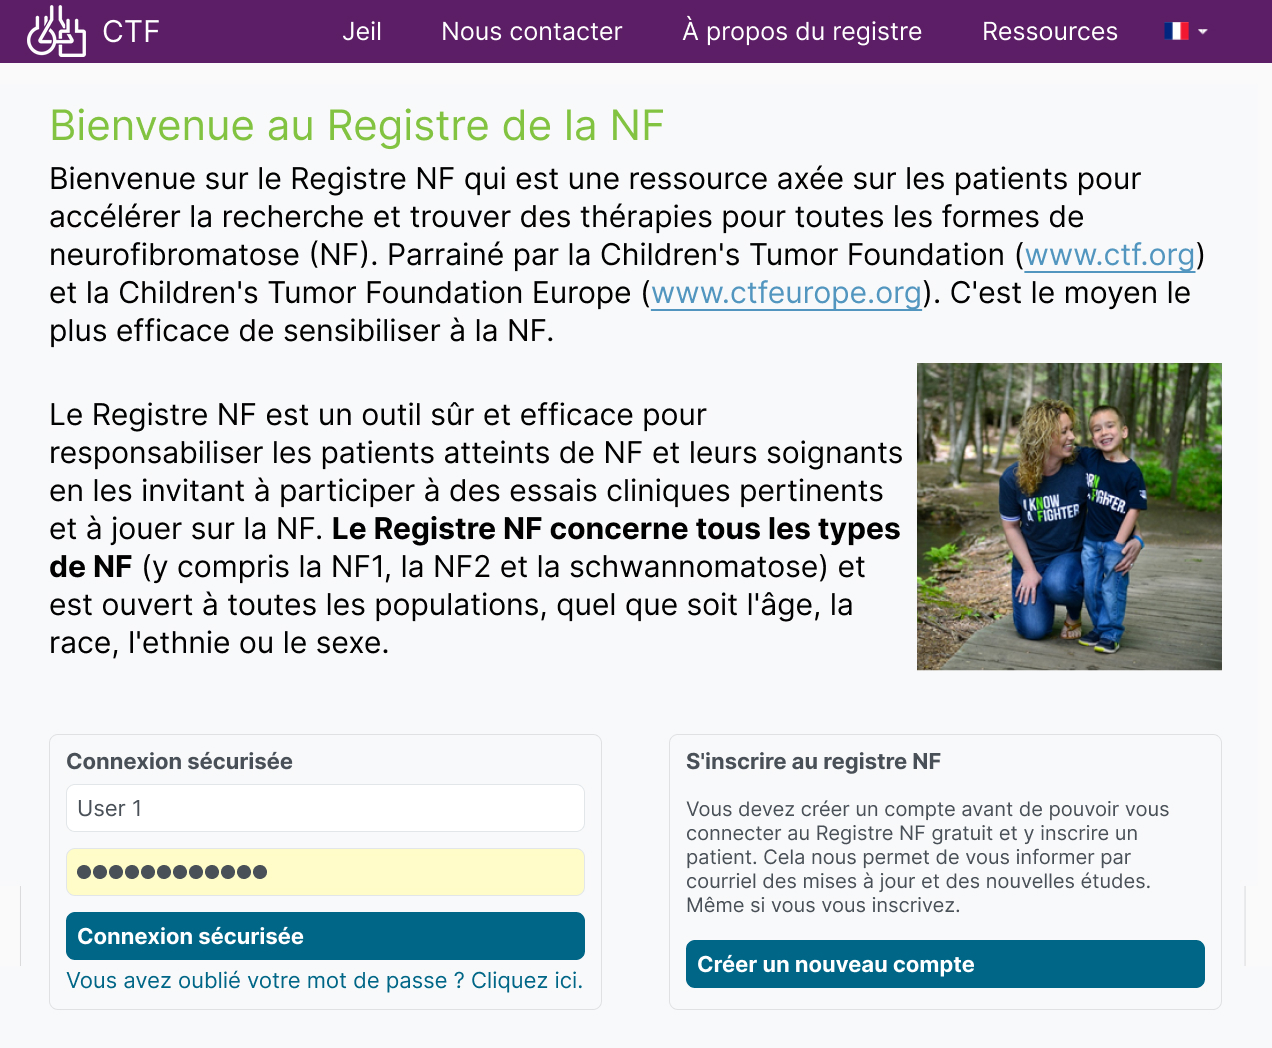
Enable patients and their advocates to locate support resources and research studies specific to their disease diagnosis.
Encourage long-term registry participation by communicating patient-specific information to your community.
- Make it easy for patients to find disease-specific resources with dashboard information hub.
- Make it easy for patients to find resources such as healthcare supports.
- Inform patients of opportunities to contribute to a new study relevant to them.
Email your community with information relevant to their specific situation.
- Set up reusable email templates and explore effectiveness of communication with metrics such as email open rate, and link click through rate (CTR).
- Communicate the entire registry population or a select cohort, by specific diagnosis or demographics.
- Email patients and their carers to contribute to a scheduled or follow-up surveys (data collection instrument)
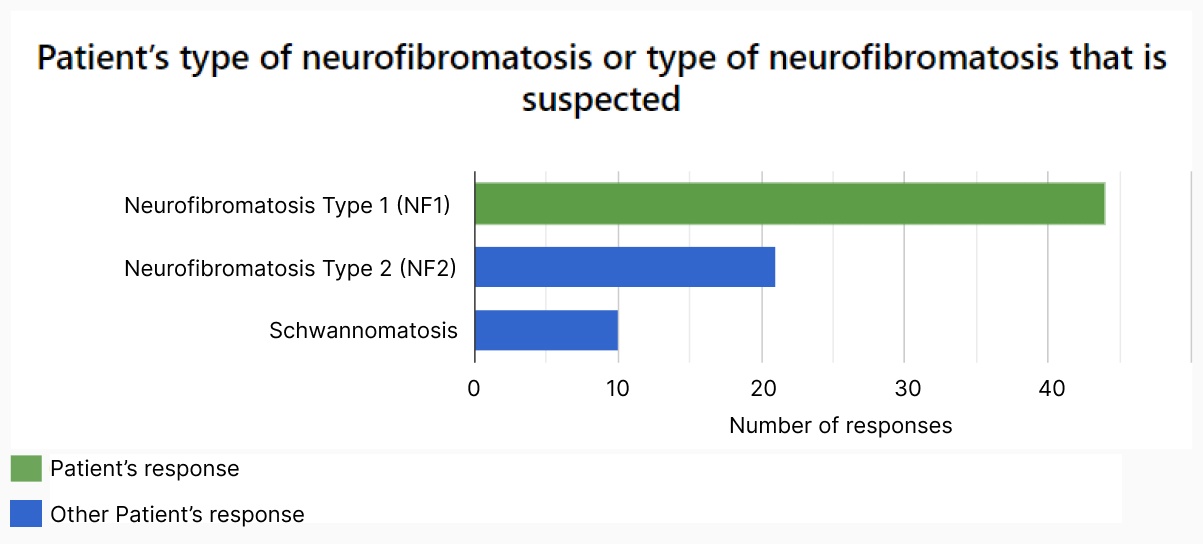
Show individual participants the data they have contributed.
Explore aggregated anonymized disease trajectory information
Provide individual patients trajectory of their specific-disease experience.

- Encourage patient participation in your registry by showing them how they and their condition compares to anonymous others in the data set.
- Encourage patients to stay involved, learn about their condition and continue to treatments and knowledge by showing them how their condition has / is changing over time.
- Help individual patients find shared experiences by showing graphs or summary experiences e.g. number of days in hospital.
Enable patients and carers to contribute real-world data.
Record daily symptoms over-time.
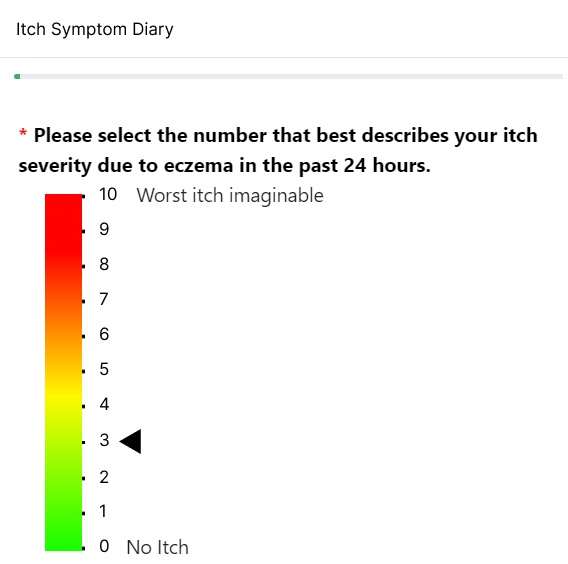
- Record symptoms at regular intervals to view and diagnose condition trends over time.
- Encourage accurate reporting of symptoms by allowing patients to enter information on the day without relying on memory at more dispersed clinical visits.
Send surveys to patients and their carers that can easily be completed on smartphone.
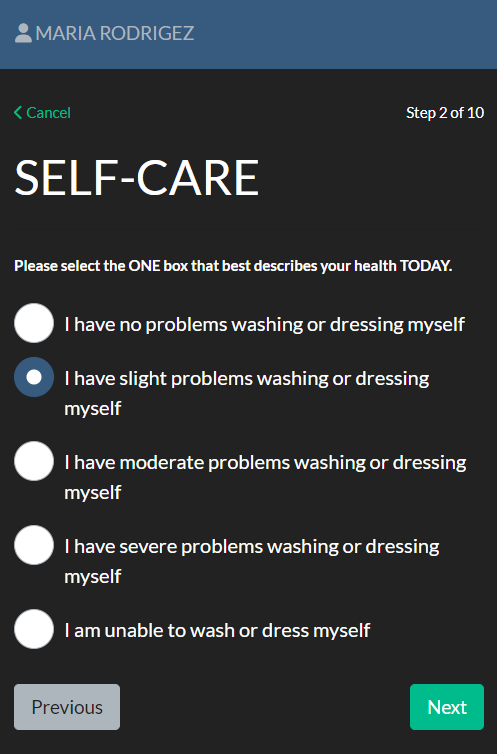
- Engage patients and/or carers with surveys that can be easily accessed and completed on their smartphone or table device.
An audit log automatically records any changes to data by date, user and the change made.
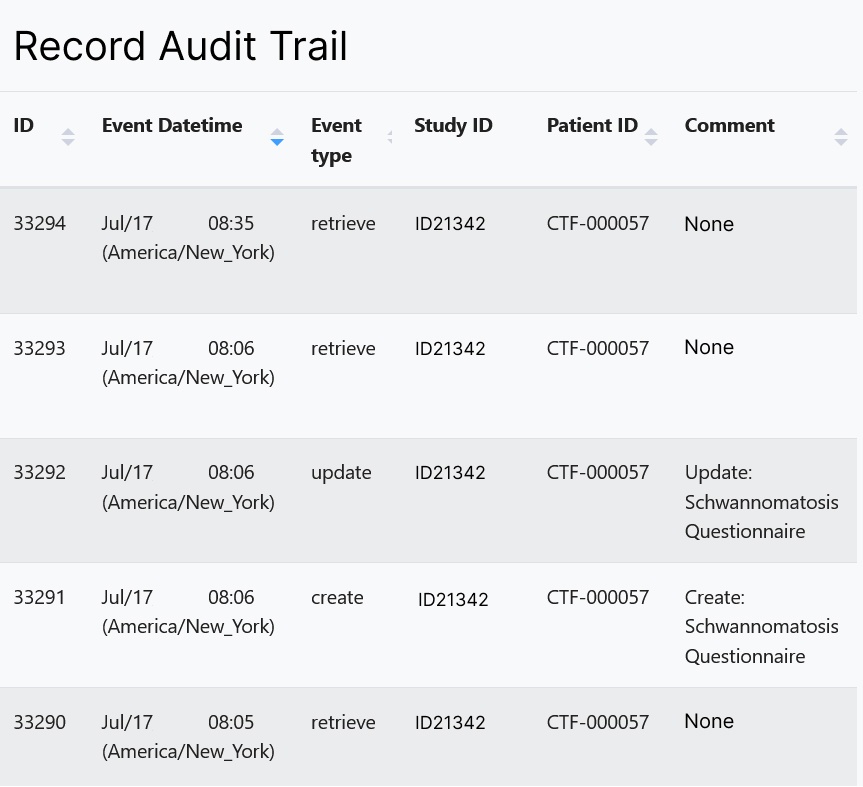
- A transparent audit log that allows those with appropriate roles and rights to view any change made within the system and as well as the user responsible for the change.
IQVIA (NYSE:IQV) is a leading global provider of advanced analytics, technology solutions and contract research services to the life sciences industry dedicated to delivering actionable insights. Learn more at www.iqvia.com.

Copyright © 2024 | Privacy Policy | Information Security Policy
OpenApplications Consulting Ltd. Registered in Ireland No. 355595

